
(Photo: Iowa Soybean Association)
Monitor water to farm smarter
May 5, 2022 | Kriss Nelson
Regular monitoring of drainage tile water could help producers better manage nutrients on their farms and, as a bonus – improve water quality.
Water monitoring and water quality were the subjects of Tuesday’s Iowa Soybean Association’s (ISA) Research Center for Farming Innovation (RCFI) Innovation To Go Webinar which can be viewed here.
During the session, Tony Seeman, ISA senior field services lab and data manager, says there are several reasons to manage water quality:
- Document conditions to get a baseline - “We want to document conditions. We want to get a baseline to understand how much nitrogen we are losing from our farm fields and put that in perspective over time,” says Seeman.
- Trends over time - Are there any trends in streams where changes have been made in the fields?
- Evaluate the effectiveness of conservation practices - Are the conservation practices being installed effective and performing properly?
- Quantify nitrogen movement on your farm - How can farmers quantify the nitrogen movement on their farm with actual data?
- Assess the performance of your nutrient management - How well are your nutrient management practices on your farm performing?
Focusing on these reasons behind water monitoring will also help meet goals set within the
Iowa Nutrient Reduction Strategy.
2021 stream concentration
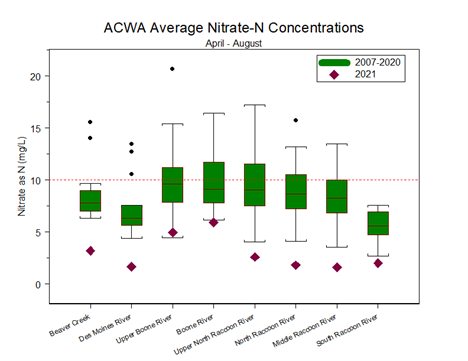
In the above graph, Seeman says levels found in stream concentrations in 2021 were some of the lowest since 1999. These unprecedented numbers are due to drought conditions.
2021 water yield
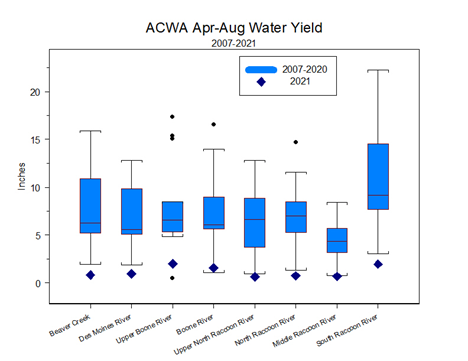
This graph shows a similar story to the stream concentration levels of last year. Water yields are measured on an acre-per-inch basis.
“With the range of 10- to 15-inches of rain, we only had two- to three inches of drainage. These results are the lowest, in some cases, we have had in this period of 2007 to 2021,” says Seeman.
April 2022 results
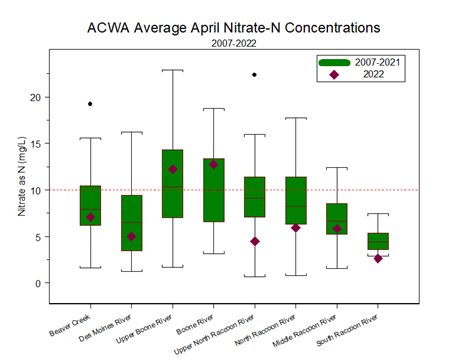
Last month’s testing shows some elevated levels compared to last year’s results.
Areas in the Beaver Creek Tributary, Des Moines River, Upper North Raccoon River, Middle Raccoon River and South Raccoon River show levels on the lower end of the range, while the Upper Boone River and Boone River sites are showing elevated nitrate levels most likely due to recent rainfall.
“We certainly have some concern with the delays in getting the crops in the ground and growing and capturing nitrogen before the nitrogen leaves below the root zone,” says Seeman.
Tile water quality data
Here are some points to consider regarding the release of tile water quality results released from ISA.
- Confidentiality - Seeman emphasized ISA does not share individual results.
- Samples are analyzed at ISA certified lab - “Our lab is certified by the state of Iowa. We have a full quality assurance program,” says Seeman.
- Tile samples come from working farms, and along with that comes variability - “This is observational data, unlike some research you may see coming from universities,” says Seeman. Universities often gather data using small plots under controlled environments.
- Some tile outlets drain multiple fields, which limits analysis of management practices - Not able to measure flow at all sites for load calculations
Interpreting results
The average of 10- to 20-milligrams per liter (Mg/L) of nitrates in the water is in line with what is expected in row crop production when nitrogen is applied at the optimum rate.
“When we think about a late-spring soil nitrate test, if we are trying to target proper fertility at the right time, looking at 20 parts per million of nitrate available to the corn plant in the soil, when you consider what can be lost, translates to about 10- to 15-Mg/L in the water,” says Seeman.
Tile nitrogen concentration data
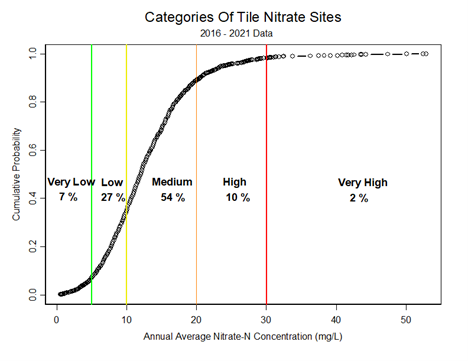
Seeman says more than half of the tiles sampled from 2016 through last year fell into the medium (10-20 mg/L) category. Only 12% fall in the high to very high category.
Tile nitrate yield of pounds per day from spring to fall
GRAPH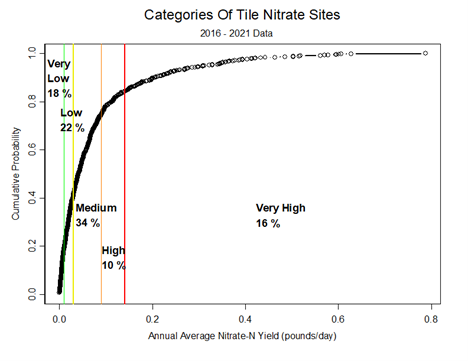
This data of nitrate loss of pounds per day shows 34% of sites listed in the medium range, with 25% of the sites ranking in the 25% of high to very high levels.
“Some of these sites could benefit from improved nutrient management, but this is also where we should target edge-of-field practices,” says Seeman. “We will have to invest in infrastructure to have a statewide impact.”
Recommendations
Suppose using the average or optimum rate of nitrogen and there are still losses of nitrogen leaching into the water. In that case, Seeman recommends reducing those numbers to meet the Iowa Nutrient Reduction Strategy.
One way could be installing edge-of-field practices.
“We don’t need to spend the money to treat water that is coming out with low levels of nitrates, but when we see water coming out of drainage tiles with high numbers, we should invest in edge-of-field practices,” says Seeman.
When there are high to very high nitrate levels in the water, Seeman says it’s time to look at nitrate management.
“This is when there is probably an economic argument to be made to adjust the 4 Rs (right source, right rate, right time and right place) because we are losing more than we should be,” he says. “That costs money, and it is probably affecting yield.”
Consider cover crops
In addition to edge-of-field practices, in-field conservation management such as no-till and strip-till cover crops could also effectively reduce nitrogen loss.
“Cover crops add additional soil health benefits,” says Seeman. “Even if you are in the low to very low category for nitrogen loss, cover crops can offer soil health benefits, reduction, and weed suppression.”
To learn more about how you can participate in ISA’s water monitoring program and how water monitoring can benefit both your operation and stewardship goals, contact Seeman at 515-334-1042 or aseeman@iasoybeans.com.
2022 Innovation TO GO Series
The 2022 Innovation TO GO Series continues throughout the summer.
Using Farmer Data to Develop More Profitable Crop Management Systems in Soybeans will be held June 7 from noon-1 p.m.
This session will take a deep dive into the variability of soybean yield and profits across Iowa’s geographic regions. Learn about the multi-year project, involvement opportunities, and outcomes to guide regional management practices to increase profitability in different corners of the state.Visit this page for more information.
Back