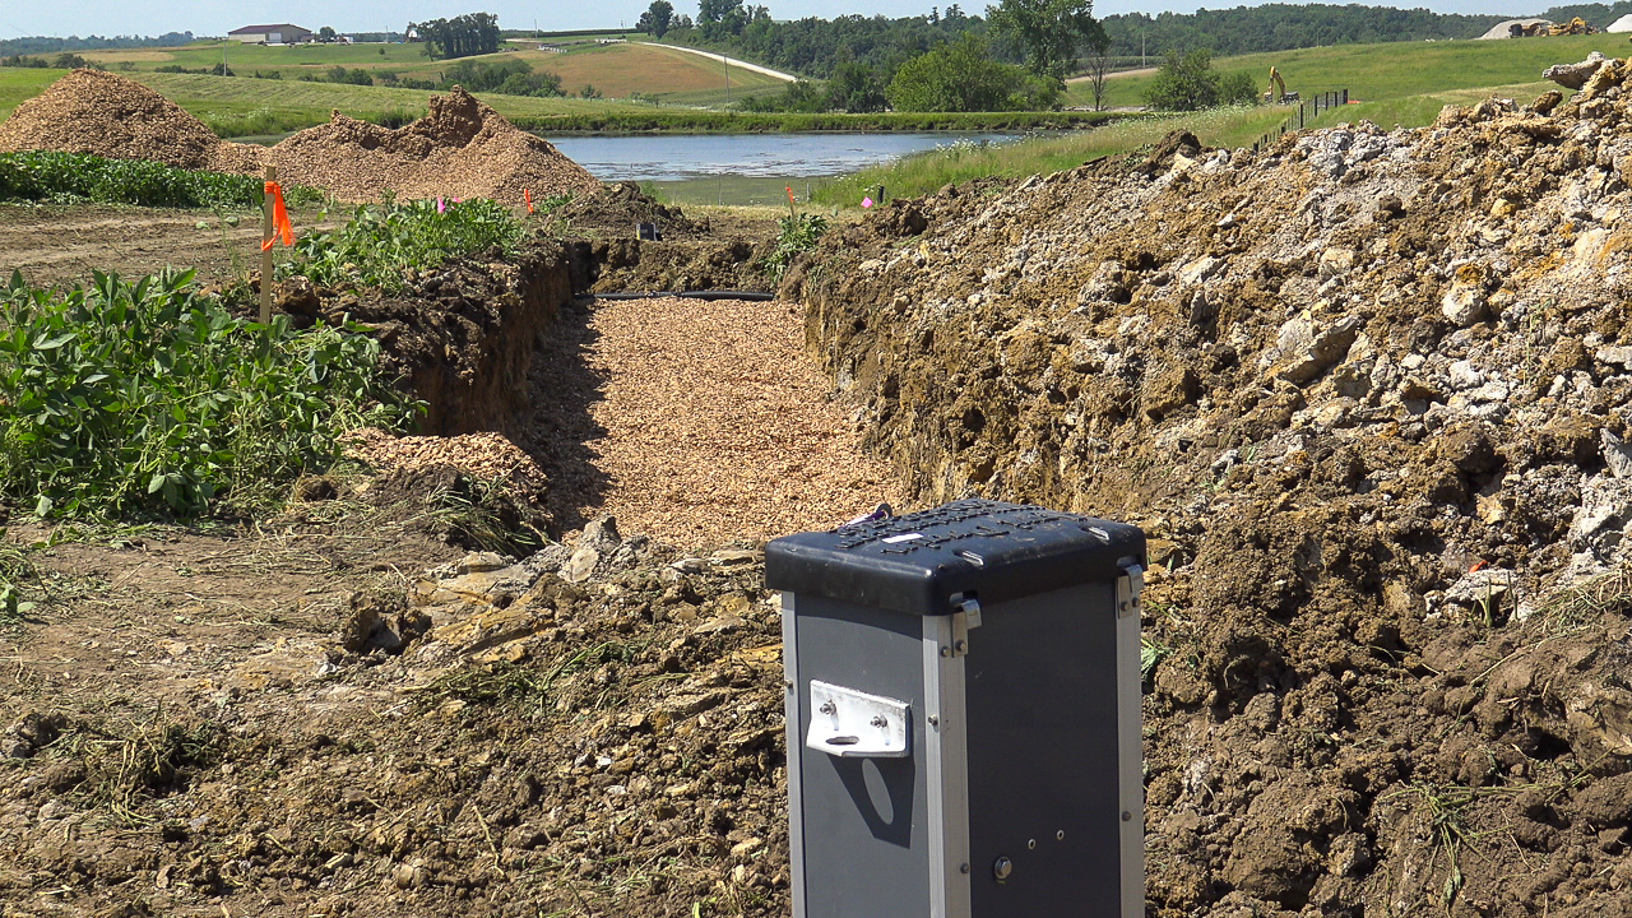
The Iowa Soybean Association uses water quality data to evaluate the effectiveness of installed practices on water quality. (Photo: Joseph L. Murphy/Iowa Soybean Association)
2019 water quality summary: Part 3
April 21, 2020 | Tony Seeman
This article is the third and final part of a series summarizing water quality data collected by Iowa Soybean Association (ISA) and partners for 2019.
The Iowa Soybean Association's (ISA) certified water lab analyzes samples from rivers, streams, individual tile outlets and edge-of-field practices from around the state. The results from the various tests are used to evaluate the effectiveness of installed practices on water quality, provided to farmers to assess their operations and utilized to target areas for planning and implementation projects. In this article we look at data from one of those water quality practices.
Blake Hollis of Lanehaven Farms near Waterloo installed a bioreactor as part of the Miller Creek Water Quality Improvement (WQI) project. Bioreactors are one example of the water quality practices in the Iowa Nutrient Reduction Strategy (INRS) for reducing nitrogen loss. Bioreactors work by diverting water from a tile drainage system through a trench filled with woodchips before it outlets to a stream, ditch, or tile main. Microbes in the woodchips convert nitrate in the drainage water into nitrogen gas that is released back to the atmosphere reducing the amount of nitrate in the drainage water.
Water quality monitoring of flow into and out of Hollis' bioreactor has been used to monitor its performance over time. Average nitrate concentration reductions from the bioreactor have been 40% since it was installed, and in 2019, nitrate concentrations were reduced by 51% on average (Figure 1 below). The INRS assumes a 43% average nitrate reduction for bioreactors. Nitrate concentration reduction is influenced by temperature, nitrate concentration of the water coming into the bioreactor and the travel time of the water in the bioreactor.
As shown in Figure 2 above, nitrate reductions were less in the spring of 2019 when the water temperatures were colder and when drainage flow is typically also highest, reducing treatment time in the bioreactor. There was another dip in nitrate concentration reduction in late summer when the nitrate concentration in the drainage water dipped to very low levels. Otherwise, the concentration reductions were over 40% for the rest of the season.
Results from for the Hollis bioreactor show the impact that adoption of water quality practices can have at the field scale. Bioreactors, along with cover crops, saturated buffers, and wetlands, are some of the most effective practices for reducing nitrogen loss from farm fields. It will take much greater adoption of individual water quality practices and sustained efforts at the watershed scale with projects like the Miller Creek WQI to meet the goals of the INRS. Data from the ISA water lab will continue to be important to evaluate the performance of these practices and demonstrate progress.
Read Part 1 Read Part 2
Back