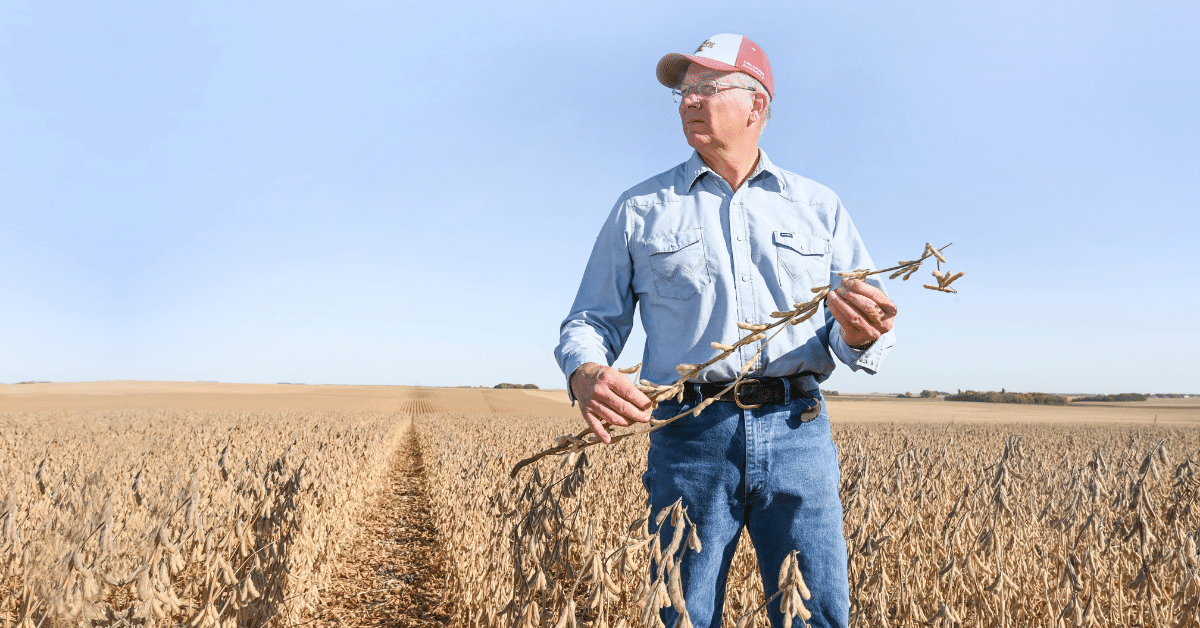
Tom Oswald, United Soybean Board director from Cleghorn. (Joseph L. Murphy/Iowa Soybean Association)
ISA-developed tool to assess economic impact of quality mapping
November 4, 2020
While soybean yield remains the driver of farmers’ economic returns, mapping quality could lead to future marketing opportunities for Iowa and U.S. farmers. Research from the Iowa Soybean Association (ISA) measures agronomic and infield management impacts on soybean quality and provides a decision tool to help farmers apply those aspects to their bottom lines.
Peter Kyveryga, ISA senior scientist of analytics, is testing tools to create maps of protein and oil.
Kyveryga says yield maps are commonplace tools in most farmers’ combines and have been vital in precision agriculture since the 1990s. These maps help farmers determine fertilizer use, seeding rates, insurance rates and even rent payments.
The maps can provide farmers with more data and may lead to more robust marketing opportunities down the road.
Strengthen price, protect yield
Kyveryga and his team are studying the effectiveness of soybean quality mapping and developing a decision tool to help farmers assess and consider economic advantages from the bean quality information.
Kyveryga’s approach has evolved from using on-board combine sensors to collecting ground truth grain samples using aerial imagery.
“We selected a certain number of sampling points from a field, combined with aerial imagery and soybean variety information, to create our soybean protein maps,” he says. “Now, with maps, we see where and how protein changes within fields.”
To apply the mapping concept to study quality, Kyveryga says farmers need to map soybean protein and oil content before harvest and tracking those characteristics.
“We worked with four farms and tracked 25 fields in 2019 to collect the images several times throughout the season. The fields were scouted and on-the-ground samples from 10 locations were collected before harvest,” says Kyveryga. Maps were then made. Farmers could analyze the performance of different soybean varieties’ yield and quality.
The next step was creating a calculator-like system to hone in on the economic factors.
“For the farmer, we are focused on developing a useful tool, allowing them to plug in different options and economic simulations. It helps farmers understand the management needed and decide if the premium outcome is worth the effort,” he says.
While he’s not sure farmers will see a game-changing marketing opportunity touting quality and protein yet, Tom Oswald, who farms near Cleghorn and serves on the United Soybean Board, says he’s a farmer who craves data to support his decisions.
“I want to know what is happening in that space,” Oswald says. “What do we understand about how protein varies in a field? Can we narrow down the management protocols and use precision agriculture and better data to provide those value components?”
Quality price potential
Grant Kimberley, ISA’s senior director of market development, says the quality piece has the potential to increase the value of Iowa and U.S. soybeans.
“If we can reach consistent increases in protein and oil content in U.S. beans, it helps us be more competitive,” says Kimberley. “When we export 60% of our beans, we need that edge.”
Brian Kemp, a Sibley-area farmer, kept a close eye on yields as he recently wrapped up his soybean harvest. “Our system still focuses on the rewards for yield,” he says. “That’s what puts money in the bank for farmers.”
But, as an American Soybean Association director active with the U.S. Soybean Export Council (USSEC), he knows U.S. soybean quality is being marketed.
“That’s what USSEC is all about, making sure buyers know the difference in the higher-quality soybean produced by U.S. farmers,” says Kemp. “Our beans with higher amino acid content are superior for feeding livestock. Right now, some markets pay extra for that value.”
Years ago, Oswald traveled to Indonesia for a fact-finding mission and spoke to a poultry producer. “He told me he feeds millions of baby chicks each year and if my (U.S.) soybeans don’t offer enough protein meal, he’ll either need to spend more to supplement those gaps or buy from somewhere else, he says.
“To be competitive, I need to find ways to make that a fit or he’ll go to another supplier.”
Industry interest
The goal on the seed side of the equation is still about yield protection, Kimberley says. This, he adds, could be comparable to livestock farmers seeking particular genetics. “That philosophy will get to seed someday.”
Kemp agrees this work can help international customers recognize U.S. quality and raise awareness for farmers and seed companies. “It’s playing a background role now as some major companies know protein content from certain areas of the U.S. are stronger and they are calculating that in the basis,” he says.
Providing tools so farmers have clearer pictures of their fields, production costs and potential premium is vital to the equation. Kyveryga hopes mapping quality becomes as commonplace as mapping yield to help farmers capture more value for their beans.
This story was originally published in the November 2020 issue of the Iowa Soybean Review. Click the brackets in the lower right corner below to enlarge the protein maps.
Back