
Global interest in gauging soybean quality has made it useful for farmers to learn about the economic benefits of higher protein beans. The Research Center for Farming Innovation has developed a tool that allows users to see the potential economic benefits to their farming operations. (Photo: Joseph L. Murphy/Iowa Soybean Association)
Economic simulator allows soybean farmers to analyze quality
January 7, 2021
By Suzanne Fey, ISA field services team, and Peter Kyveryga, ISA senior research scientist-analytics
Farmers’ ability to document, predict, and analyze quality is providing them an important metric for evaluating economic return. As the international market becomes more competitive, global soybean purchesers are looking into quality metrics, such as protein and oil content, to make their buying decisions.
The Iowa Soybean Association’s (ISA) Research Center for Farming Innovation (RCFI) is researching topics impacting the economics of soybean quality marketing, in addition to exploring the use of aerial imagery and on-the-go sensing to streamline mapping in-field soybean oil and protein quality.
Quantifying and demonstrating increased soybean quality would give farmers and U.S. soybeans a competitive advantage in the international market. To explore the potential economic benefit of premium payments for higher protein soybeans, the RCFI is developing a free, interactive, web-based tool to simulate the economics of soybean quality premium payments.
A beta version of the Soybean Quality Economic Simulator tool allows users full control of several input variables. Graphic feedback shows a range of potential economic benefits generated by premium payments for higher protein soybeans. Return to potential soybean protein premium payments can be estimated in two ways:
1. Return based on $/bushel protein premium. Negative yield change values are outlined in black and initial premium payment increment is outlined in red.
2. Return based on $/per % increase protein premium. Negative yield change values are outlined in black and initial premium payment increment is outlined in red.
The tool also provides a unique comparison of $/bushel scenarios and enables simultaneous visualization of up to four scenarios.
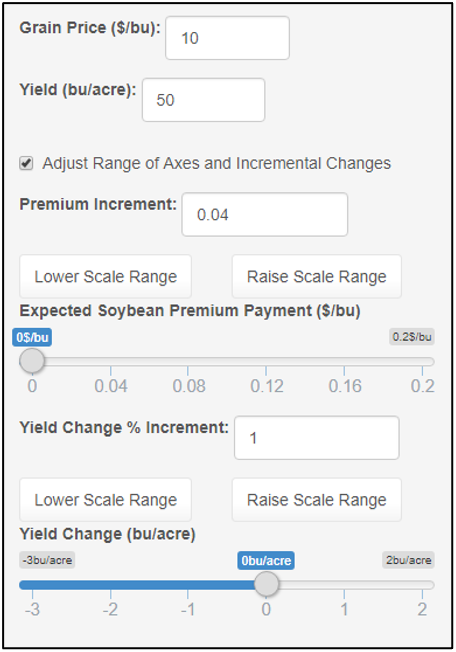
Figure 1 (right) shows the interactive and adjustable inputs to visualize economic return.
Return can be visualized in the following ways: as a return matrix, return lines, or return table, and as indicated above, as a multiple return matrix for different combinations of soybean price, protein premium and yield changes resulting from a new practice or protein enhancing variety.
Each visualization allows users to see the possible impact of positive or negative yield change from different seed genetics favoring higher protein.
Figure 2 (below) offers a visualization of economic return ($/acre) from soybean protein premium ($/bu) breaking it down by: a) return matrix ($/acre) with a premium payment ($/bu), b) return lines ($/acre) showing slope of premium payment ($/bu) over yield change (bu/acre), and c) return table ($/acre) breaking down a premium payment ($/bu) for range of yield change (bu/acre).
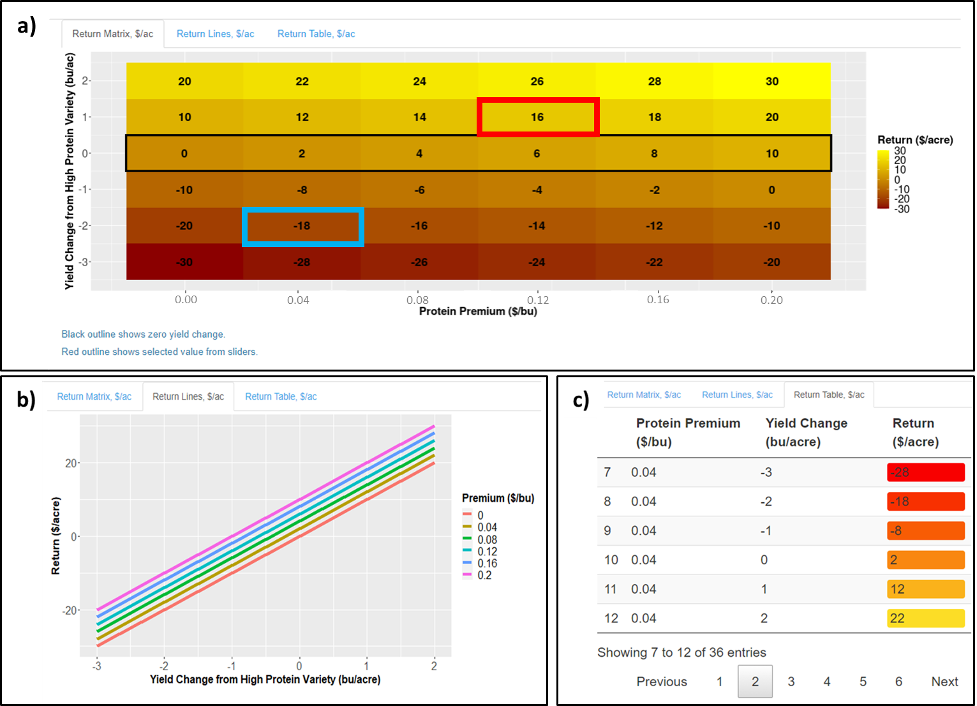
In the return matrix of Figure 2 (above), the cell highlighted in red is selected using the input sliders found in Figure 1. This helps the user navigate to find the exact return based on the inputs they would like to know. In this example, the red cell shows return ($/acre) for a hypothetical positive yield change of 1 (bu/acre) and a premium payment of $0.12 per bushel. In comparison, the cell highlighted in blue shows return ($/acre) with a hypothetical negative yield change of -2 (bu/acre) and a premium payment of $0.04. So, to achieve the best economic return, higher protein would not reduce yield.
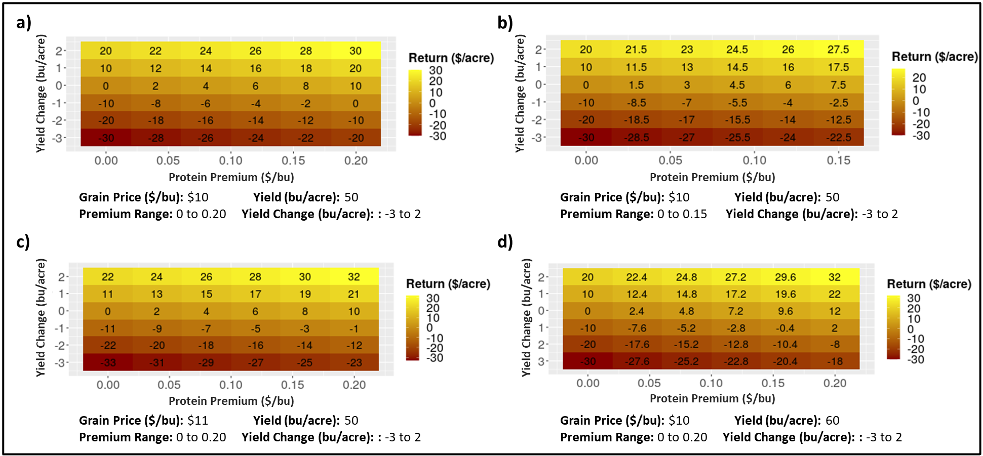
Figure 3 (below) shows comparison between return matrices ($/acre) for 4 scenarios: a), b), c), and d), with each scenario having different inputs demonstrating variation in economic return.
There are other factors besides yield, protein level, and premium that affect the economics of soybean quality. ISA experts intend to enhance the beta version of this simulation tool to include adjustments for additional variables, such as extra transportation cost to a destination paying a protein premium, and potential additional cost of higher protein seed varieties.
In its present iteration, users will still find an opportunity to assess what premium payment amount would likely justify the addition of quality improvement to the focus of their cropping efforts. Similar economic simulations and online interactive visuals will be used to evaluate other agronomic and conservation practices.
ISA invites farmers to go to the tool using the link below to explore increased revenue possibilities with enhanced soybean quality.
Open Tool
Back