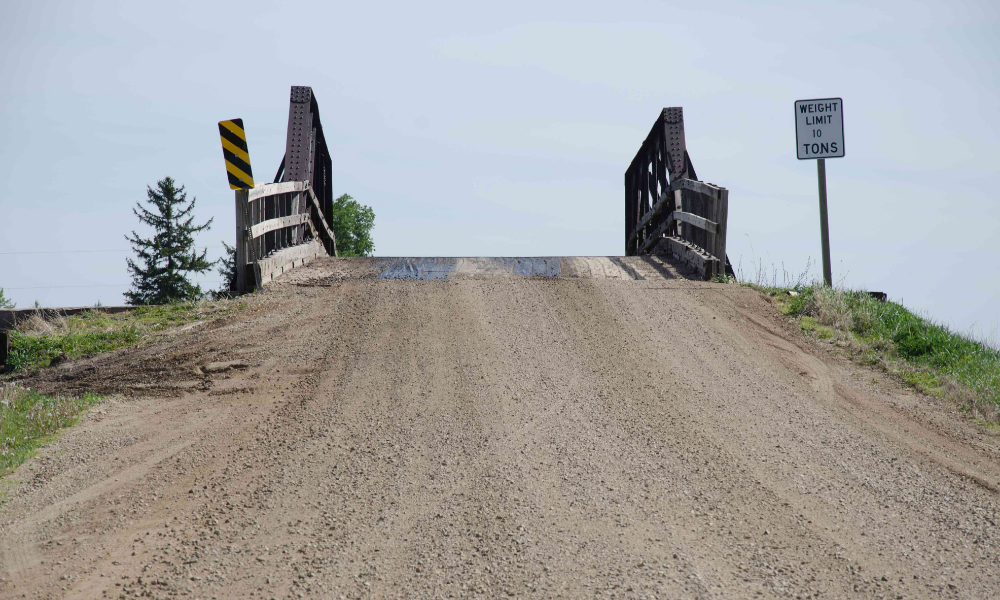
(Photo: Iowa Soybean Association)
Bridge report highlights improvement, much work remains
April 28, 2021
By Mike Steekhoek, Executive Director of the Soy Transportation Coalition
The American Road and Transportation Builders Association (ARTBA) recently released its annual “Bridge Conditions Report” that highlighted 45,023 bridges in the United States are rated as “structurally deficient” – 7.3% of the nation’s total bridge inventory. While this is an improvement from the 48,559 structurally deficient bridges (7.9%) in 2016, the condition of bridges remains a challenge – particularly in rural areas.
The data provided for the ARTBA report was provided by the Federal Highway Administration. Read the full report.
A structurally deficient bridge does not mean that the bridge is unsafe or in danger of collapse. The designation refers to those bridges that have one or more components that require repair. The Federal Highway Administration bridge ratings are on a scale of 0 to 9 with 9 being “excellent” and zero being “failed.” A bridge is rated in good condition if the deck (riding surface), superstructure (supports immediately below the deck), and the substructure (foundation and supporting piling and posts) are rated in a condition of 7 to 9. If any of the three main bridge elements are rated 5 or 6, a bridge is rated as fair condition. A structurally deficient (or poor) designation is assigned to a bridge with a deck, superstructure, or substructure rated in a condition of 4 or less.
Bridge Condition Rankings for Soy Transportation Coalition States: # of Structurally Deficient Bridges
| State |
Number of Bridges |
Number of Structurally
Deficient Bridges |
State Ranking
(out of 50) |
| Iowa |
23,982 |
4,571 |
1 |
| Illinois |
26,848 |
2,374 |
3 |
| Missouri |
24,538 |
2,190 |
5 |
| Ohio |
27,072 |
1,377 |
12 |
| Kansas |
24,948 |
1,321 |
13 |
| Nebraska |
15,348 |
1,302 |
14 |
| Michigan |
11,271 |
1,219 |
15 |
| Indiana |
19,327 |
1,111 |
16 |
| South Dakota |
5,880 |
1,038 |
17 |
| Kentucky |
14,422 |
1,033 |
15 |
| Tennessee |
20,235 |
881 |
20 |
| Minnesota |
13,471 |
661 |
24 |
| North Dakota |
4,312 |
444 |
30 |
Bridge Condition Rankings for Soy Transportation Coalition States: % of Bridges Rated as Structurally Deficient
| State |
Percent of Structurally
Deficient Bridges |
State Ranking
(out of 50) |
| Iowa |
19.1% |
2 |
| South Dakota |
17.7% |
4 |
| Michigan |
10.8% |
9 |
| North Dakota |
10.3% |
10 |
| Missouri |
8.9% |
14 |
| Illinois |
8.8% |
15 |
| Nebraska |
8.5% |
18 |
| Kentucky |
7.2% |
24 |
| Indiana |
5.7% |
30 |
| Kansas |
5.3% |
33 |
| Ohio |
5.1% |
36 |
| Minnesota |
4.9% |
39 |
| Tennessee |
4.4% |
41 |
In the effort to promote more cost-effective approaches to replacing and repairing rural bridges without compromising safety, the STC has released the report, “The Top 20 Innovations for Rural Bridge Replacement and Repair.” The report features ten rural bridge replacement and ten rural bridge repair innovations. The full report can be accessed at www.soytransportation.org.
Back