
Many places in Iowa have received excessive rainfall over the past two weeks, and coupled with record-high input costs, understanding how to manage nitrogen in wet conditions matters now more than ever. (Photo: Iowa Soybean Association).
Adapting nitrogen fertilizer management for excessive rainfall
June 23, 2022 | Kriss Nelson
This is part 1 of 2 in a series of managing nitrogen in a challenged environment
When it comes to nitrogen application, weather and price matter.
Many places in Iowa have received excessive rainfall during the last two weeks, and coupled with record-high input costs, understanding how to manage nitrogen in wet conditions matters now more than ever.
A project funded in part by the Iowa State University (ISU) Center for Agricultural and Rural Development (CARD), the Iowa Soybean Association (ISA) Research Center for Farming Innovation (RCFI) and the ISU Department of Economics studied adaptative behavior and the need to adjust nitrogen fertilizer use to abnormal rainfalls. A higher frequency and elevated rainfall variability can increase uncertainty regarding how to maximize yield while minimizing excess nitrate discharge into our water supply.
The projected utilized rich data sets of on-farm replicated trials and field surveys from ISA to investigate the effects of abnormal rainfall on farm nitrogen management, considering both farmer profitability and the potential for environmental damages.
Peter Kyveryga, ISA senior research scientist and director of analytics, says common wisdom would suggest in years with excessive rainfall, farmers might need to apply a slightly higher nitrogen rate to avoid yield loss due to excessive leaching or denitrification.
“This makes sense in general, but both the price of nitrogen and corn should first be considered, in addition to the risk of yield penalty from suboptimal nitrogen applications,” he says.
Farmers and agronomists often rely on guidance from extension recommendations or their own experience to accurately achieve optimal nitrogen application rates. The difference between yield at the optimal nitrogen rates, calculated at harvest, and yield at the rates farmers apply can create a yield loss.
Economists at ISU created a penalty equation to calculate yield loss based on deviation from the optimal (maximum-yielding or maximum profit) nitrogen level. In other words, if the farmer’s rate is truly optimal, the penalty is negligible. If a farmer’s choice is off, the yield loss and the penalty are high, reducing profitability.
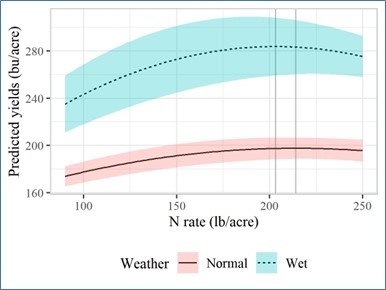
Figure 1. Yield response to nitrogen application estimated from analyses of 35 on-farm trials with five nitrogen rates across Iowa from 2017 to 2021 for corn after soybean. For each field, we define weather as wet if May to June rainfall exceeded the 80th percentile of the empirical rainfall distribution of the previous 25 years.
Data shows the yield penalty doubles with wet rainfall for corn after soybean (Figure 1). The penalty represents the curvature of the yield response curve in the graph. The higher penalty in wet conditions, shown in blue, means an error in nitrogen application could be more costly in terms of yield losses.
For example, the yield penalty under normal weather is approximately 0.9, implying that a 25 lb/acre error in nitrogen application would reduce corn yield by close to 1 bu/acre, or 0.6%. Assuming an average yield of 177 bu/acre (based on the USDA’s WASDE report). The yield penalty increases to 2.19 with excessive rainfall, and yield becomes more sensitive to the N rate. The same 25 lb/acre error in N use would result in a yield loss of about 1.2% with excessive rainfall. Furthermore, the yield penalty more than triples to 3.155 in the case of extreme rain. A 25 lb/acre error would reduce yield by approximately 1.85%
The yield response curve also tends to be steeper for lower levels of nitrogen use. This means nitrogen tends to be more productive in wet conditions.
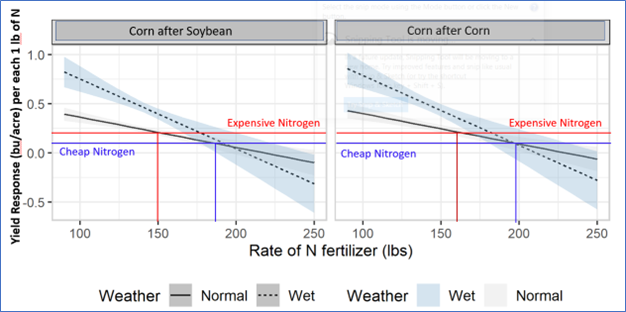
Figure 2: Marginal yield response (bu/acre) to each additional lb. of nitrogen from analyses of 35 on-farm trials with five nitrogen rates across Iowa from 2017 to 2021 for corn after soybean and corn after corn. Cheap nitrogen implies a nitrogen-to-corn price ratio of 0.1 and expensive nitrogen implies a nitrogen-to-corn price ratio of 0.2 and 0.16. The optimal rate is at the intersection of the marginal cost of nitrogen (a horizontal red line-expensive nitrogen and a horizontal blue line). Another way to solve the dilemma of choosing optimal nitrogen rates for wet and normal weather conditions is to consider the marginal yield response in bu/acre for each additional pound (lb) of N applied (Figure 2).
Unlike in Figure 1, when corn yield increases over a range of nitrogen rates, the marginal yield response is the slope of the yield curve and is always trending down. The more nitrogen farmers apply, the lower the payback from nitrogen due to the law of diminishing returns. In Figure 2, the optimal N rates can be estimated by equating the marginal cost line, the cost of units of N in bu/acre grain (the horizontal blue and red lines), to the marginal yield response.
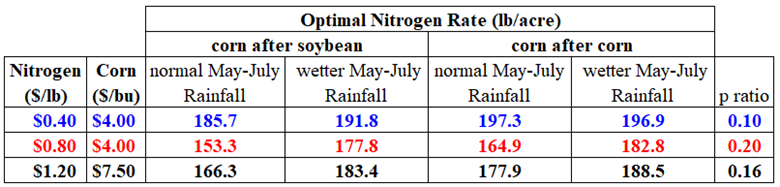
“Surprisingly, we found that at the common or cheap nitrogen-to-corn price ratio scenario (the blue horizontal line), the difference between optimal rates for wet and normal weather is minimal (from 0 to 6 lb N/acre),” says Kyveryga. For example, the estimated optimal rates were about 190 lb N/acre for corn after soybean and about 197 lb N/acre for corn after corn when nitrogen-to-corn price was 0.1 ($0.40/lb fertilizer price divided by $4/bu corn price). There is more uncertainty for wet conditions, as shown by the wider shaded confidence band, which represents the margin of error.”
However, the study shows when nitrogen fertilizer becomes more expensive (the red horizontal line), or approximately one and half or twice as much as cheap nitrogen (nitrogen-to-corn price ratio of 0.16 or 0.2), the optimal rates are nearly 15 to 30 lb/acre lower than when nitrogen fertilizer is cheap. At the same time, the difference between optimal rates for wet and normal weather becomes larger, about 25 lb N/acre for corn after soybean and about 20 lb N/acre for corn after corn, (See table below Figure 2) when the nitrogen-to-corn price ratio increases to 0.16 or to 0.2.
Part two of this story will discuss how optimal rates for farmers to maximize profit compared to the optimal rates for social planners hoping to reduce environmental damage from excessive nitrogen runoff and leaching into our streams and waterways.
Back